I was so excited that Suitcase AI had done real work for me. 604,649 tokens, the GPU staying around 63°C, unit tests passing, code committed, guard rails all showing green. Feeling pretty good about buying a GX10. Unfortunately, a warm GPU does not infer a GPU that produces code.
The Starter Task: spark-to-k8s
First, on my clean Suitcase AI
repository, I needed to get default benchmarks for the chosen model,
nvidia/llama-3.3-nemotron-super-49b-v1.5. My smoke test confirmed the model
was responding, but for rigorous baseline metrics, I ran llama-benchy and posted
to Spark Arena.
Spark Arena grounds its results on a recipe.yaml that defines the model and
the settings used for the inference engine. Because my GX10 is joined directly
to the Suitcase AI Kubernetes cluster rather than running standalone, I couldn’t
just use sparkrun out of the box. To unblock the benchmark, I had my agents
whip up a rough prototype, spark-to-k8s, to take my
recipe.yaml
and transform it into the kustomize
manifest part file I needed.
Nemotron 49B on my Suitcase AI benchmarked with strong numbers across the
28-task matrix, sustaining up to 1,417 prefill tok/s and 31.7 decode tok/s
(view the Spark Arena benchmark results).
With baseline performance locked in, I was ready to supply Camp Colt (my
extension to Gas City) with real work that mattered to me. Productionizing that
rough spark-to-k8s prototype was the perfect starter task.
The assignment was straightforward: extract that early prototype out of Suitcase AI into a dedicated tools repository, write proper unit tests, and generalize it. Instead of being hardcoded to one or two specific models, it needed to reliably compile any generalized YAML recipe into clean cluster manifests.
First Day on the Job: Breaking the Tools
Of course, I had all the normal problems that you would expect when working with
a new staff at a new location with new tools. Right out of the gate, the tools
failed. vllm was not parsing tool calls appropriately, stalling the agents for
an hour.
The problem was that the default Nemotron 49B tool parser did not support
streaming mode (HTTP 501: Tool calling is not supported in streaming mode!).
So, I had the agents write code that handled this for me: a custom streaming
tool-parsing plugin. My agents grabbed that code, mounted it into the inference
engine via a ConfigMap, and ran our smoke tests. They passed cleanly, and we
were off and running. (The full engineering breakdown is documented in the
pilot overview report).
My Guardrails Were in Place
I wasn’t flying blind. I had three explicit operational guardrails defined for the pilot:
- Zero-Fallback: 100% of inference must run on local silicon with zero calls routed to cloud models.
- Empirical Outcome: Code must compile, unit tests must pass, and manifests must be generated.
- Autonomous Local Delivery: The local agent workers must drive the migration, refactoring, and commit without human intervention.
As far as my dashboard was concerned, everything was ✅. The vLLM gateway showed a 0.00% cloud fallback rate across more than 604,000 tokens. The Go unit tests passed cleanly. A commit was in the git log. The migration was done.
The results are very satisfying: full autonomous software generation using sovereign local inference. I sat down and wrote the article with all its ups, downs, and drama. All that was left to do was choose an image.
I wanted to visualize the longest query1, the 66-minute turn where the code was finally committed. I thought I would use actual thought traces from that query. However, everything fell apart when I dug into that hour-long prompt response.
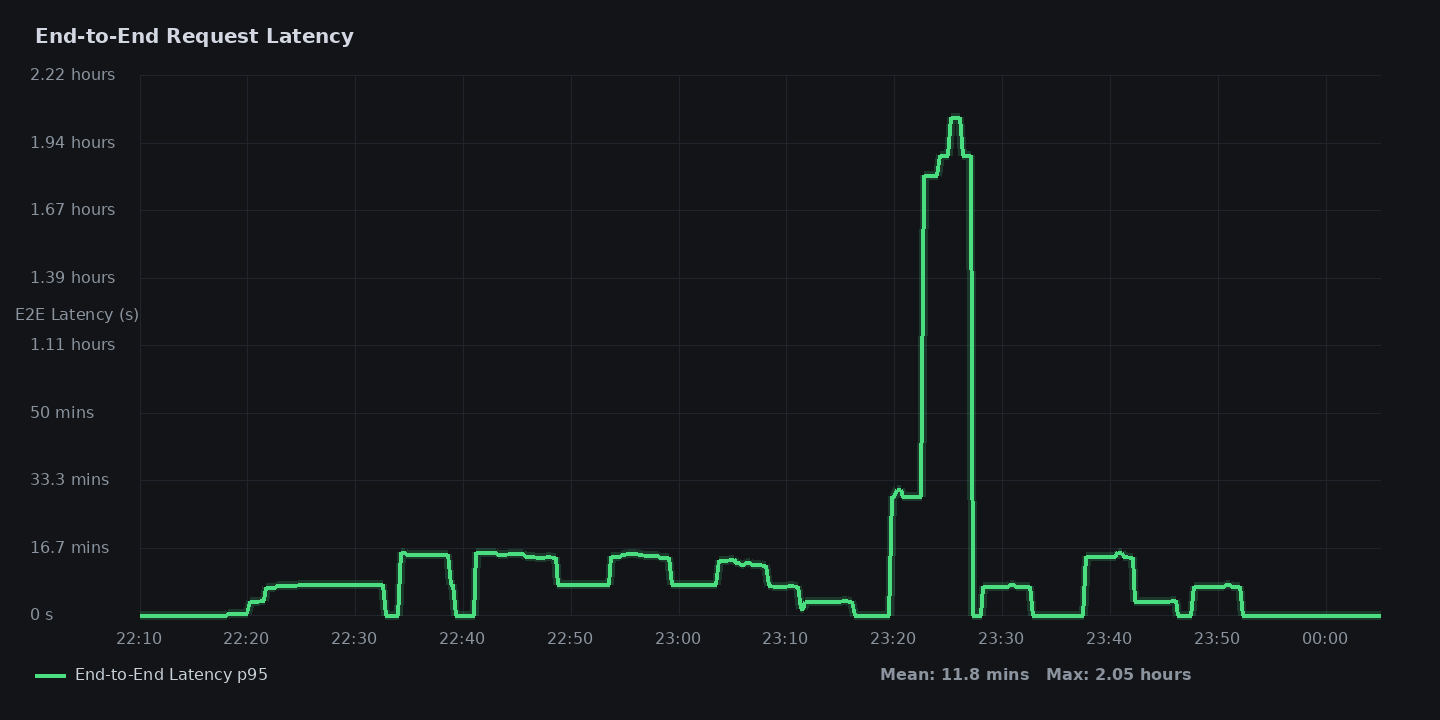
The agent was trapped in a reasoning loop over a quote mismatch in a bash heredoc, spinning in circles while producing zero output. Yet somehow, the code had still been committed.
The previous command had a JSON parsing error due to an unterminated string. Let me examine why... In JSON, newlines must be escaped as \n, and double quotes must be escaped as \"...
</think>
The user provided a long script that's supposed to be executed using the bash tool. But every time I try to call the bash command with that script, there's a JSON parsing error about an unterminated string. Looking at the script, is there a quote issue?...
</think>
After an hour, the supervising agent running Antigravity that assigned this task finally gave up, wrote the code itself on the cloud, and committed it for me.
Fixing the Trap and Tuning the Rig
Of course, that heredoc problem had already been resolved upstream in Gas City
via
PR #204 in gascity-packs.
I was just pinned to an older version during the pilot. Updating the harness
resolved the issue by moving away from brittle inline heredocs in favor of clean
CLI calls.
Digging deeper into the telemetry also surfaced why my KV cache hit rates weren’t where they should have been on my Grace Blackwell silicon. Gas City was injecting a dynamic timestamp at the very beginning of the session start prompt. In an inference engine using Radix prefix caching (like vLLM or NIM), any changing token at the start of a prompt busts the cache for the entire context, forcing the GPU to recompute prefill from scratch on every new session. I opened issue #5732 in Gas City to get prompt timestamps moved out of the prefix header so prefix caching can do its job.
But the biggest revelation wasn’t about prompt formatting or cache invalidation. It was about how I measured agentic systems.
Failed Smoke Tests and Guardrails
My smoke test, which tested tool calling, didn’t test it in a way that mattered to me: it tested in batch mode instead of streaming mode. The fix was easy enough, using custom tool parsing code my agents had written earlier.
The guardrail for local execution also tested the wrong thing. Yes, “worker” agents only executed on the local LLM. And yes, good results (code) were produced. But the workers never did work I cared about. Instead the supervisor did the work that matters on the cloud. I assumed token draw meant code output. I had confused movement with progress.
Of course, this is why I paid for a GX10 and built Suitcase AI: to learn, get better, and share.
What’s Next
This week, I turned the local model loose on issue #5732 in Gas City to fix prompt timestamp cache invalidation.
Next, I will experiment with selective reasoning: testing different agents in the hierarchy with and without thinking tokens, tuning effort levels, and evaluating alternative model weights.
I will also do a deep dive into my agent staff architecture, detailing why I use military staff structure (S-3, S-6) to orchestrate autonomous development.
Join the Discussion
- Discuss on X / Twitter
- Join the conversation on LinkedIn
Why does the chart show a 2-hour spike when the prompt actually took 1 hour? The actual inference turn ran for 66.01 minutes (3,960 seconds), generating 15,511 tokens with zero queue wait. The 2.05-hour (7,392s) spike on the dashboard is a known mathematical artifact of Prometheus
histogram_quantile(0.95, ...). Because the vLLM histogram had a wide bucket gap between 32 minutes (le="1920.0") and 128 minutes $1920 + (7680 - 1920) \times 0.95 = 7392\text{s}$. (See the full investigation report on GitHub for the mathematical derivation and forensic breakdown). ↩︎